
Page 33 - Policy Economic Report - Feb 2026
P. 33
POLICY AND ECONOMIC REPORT
OIL & GAS MARKET
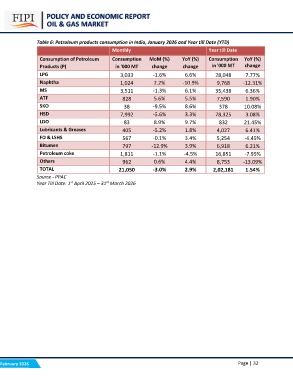
Table 6: Petroleum products consumption in India, January 2026 and Year till Date (YTD)
Monthly Year till Date
Consumption of Petroleum Consumption MoM (%) YoY (%) Consumption YoY (%)
Products (P) in '000 MT change
change in '000 MT change
LPG 3,033 -1.6% 6.6% 28,048 7.77%
2.2% -10.9% 9,768 -12.31%
Naphtha 1,024 -1.3% 6.1% 35,438 6.36%
5.6% 5.5% 7,590 1.90%
MS 3,511 -9.5% 8.6% 378 10.08%
-5.6% 3.3% 78,325 3.08%
ATF 828 8.9% 9.7% 832 21.45%
-5.2% 1.8% 4,027 6.41%
SKO 38 -0.1% 3.4% 5,254 -4.45%
-12.9% 3.9% 6,918 6.21%
HSD 7,992 -1.1% -4.5% 16,851 -7.95%
0.6% 4.4% 8,753 -13.09%
LDO 83 -3.0% 2.9% 2,02,181 1.54%
Lubricants & Greases 405
FO & LSHS 567
Bitumen 797
Petroleum coke 1,811
Others 962
TOTAL 21,050
Source - PPAC
Year Till Date: 1st April 2025 – 31st March 2026
February 2026 Page | 32