
Page 30 - Policy Economic Report - Feb 2026
P. 30
POLICY AND ECONOMIC REPORT
OIL & GAS MARKET
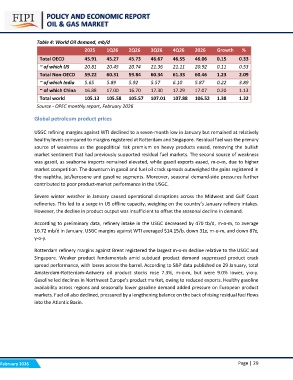
Table 4: World Oil demand, mb/d
2025 1Q26 2Q26 3Q26 4Q26 2026 Growth %
46.67 46.55 46.06 0.15 0.33
Total OECD 45.91 45.27 45.73 21.36 21.11 20.92 0.11 0.53
60.34 61.33 60.46 1.23 2.09
~ of which US 20.81 20.45 20.74 5.57 6.10 5.87 0.22 3.89
17.30 17.29 17.07 0.20 1.13
Total Non-OECD 59.22 60.31 59.84 107.01 107.88 106.52 1.38 1.32
~ of which India 5.65 5.89 5.92
~ of which China 16.88 17.00 16.70
Total world 105.13 105.58 105.57
Source - OPEC monthly report, February 2026
Global petroleum product prices
USGC refining margins against WTI declined to a seven-month low in January but remained at relatively
healthy levels compared to margins registered at Rotterdam and Singapore. Residual fuel was the primary
source of weakness as the geopolitical risk premium on heavy products eased, removing the bullish
market sentiment that had previously supported residual fuel markets. The second source of weakness
was gasoil, as seaborne imports remained elevated, while gasoil exports eased, m-o-m, due to higher
market competition. The downturn in gasoil and fuel oil crack spreads outweighed the gains registered in
the naphtha, jet/kerosene and gasoline segments. Moreover, seasonal demand-side pressures further
contributed to poor product-market performance in the USGC.
Severe winter weather in January caused operational disruptions across the Midwest and Gulf Coast
refineries. This led to a surge in US offline capacity, weighing on the country’s January refinery intakes.
However, the decline in product output was insufficient to offset the seasonal decline in demand.
According to preliminary data, refinery intake in the USGC decreased by 470 tb/d, m-o-m, to average
16.72 mb/d in January. USGC margins against WTI averaged $14.15/b, down 31?, m-o-m, and down 87?,
y-o-y.
Rotterdam refinery margins against Brent registered the largest m-o-m decline relative to the USGC and
Singapore. Weaker product fundamentals amid subdued product demand suppressed product crack
spread performance, with losses across the barrel. According to S&P data published on 29 January, total
Amsterdam-Rotterdam-Antwerp oil product stocks rose 7.3%, m-o-m, but were 9.0% lower, y-o-y.
Gasoline led declines in Northwest Europe’s product market, owing to reduced exports. Healthy gasoline
availability across regions and seasonally lower gasoline demand added pressure on European product
markets. Fuel oil also declined, pressured by a lengthening balance on the back of rising residual fuel flows
into the Atlantic Basin.
February 2026 Page | 29