
Page 34 - Policy Economic Report - October 2025
P. 34
POLICY AND ECONOMIC REPORT
OIL & GAS MARKET
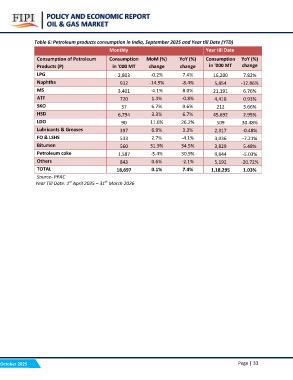
Table 6: Petroleum products consumption in India, September 2025 and Year till Date (YTD)
Monthly Year till Date
Consumption of Petroleum Consumption MoM (%) YoY (%) Consumption YoY (%)
Products (P) change in '000 MT change
in '000 MT change
7.82%
LPG 2,803 -0.2% 7.4% 16,200 -12.86%
-14.9% -8.4% 5,854 6.76%
Naphtha 932 -4.1% 8.0% 21,191 0.93%
1.3% -0.8% 4,418 3.66%
MS 3,401 6.7% 0.6% 212 2.95%
3.3% 6.7% 45,692 30.48%
ATF 720 11.6% 26.2% 509 -0.48%
6.9% 3.3% 2,317 -7.21%
SKO 37 2.7% -4.1% 3,036 5.48%
31.9% 34.5% 3,829 -5.03%
HSD 6,794 -5.4% 30.9% 9,844 -20.72%
0.6% -2.1% 5,192 1.03%
LDO 90 0.1% 7.4% 1,18,295
Lubricants & Greases 397
FO & LSHS 533
Bitumen 560
Petroleum coke 1,587
Others 843
TOTAL 18,697
Source- PPAC
Year Till Date: 1st April 2025 – 31st March 2026
October 2025 Page | 33