
Page 33 - Policy Economic Report - November 2025
P. 33
POLICY AND ECONOMIC REPORT
OIL & GAS MARKET
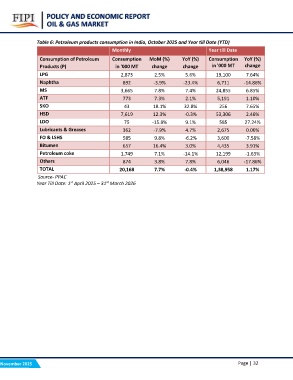
Table 6: Petroleum products consumption in India, October 2025 and Year till Date (YTD)
Monthly Year till Date
Consumption of Petroleum Consumption MoM (%) YoY (%) Consumption YoY (%)
Products (P) in '000 MT change change
change in '000 MT
7.64%
LPG 2,873 2.5% 5.6% 19,100 -14.86%
-3.9% -23.4% 6,711 6.85%
Naphtha 892 7.8% 7.4% 24,855 1.10%
7.3% 2.1% 5,191 7.65%
MS 3,665 18.1% 32.8% 256 2.46%
12.3% -0.3% 53,306 27.24%
ATF 773 -15.8% 9.1% 585 0.06%
-7.9% 4.7% 2,675 -7.58%
SKO 43 9.8% -6.2% 3,600 3.91%
16.4% 3.0% 4,435 -1.63%
HSD 7,619 7.1% -14.1% 12,199 -17.86%
3.8% 7.8% 6,046 1.17%
LDO 75 7.7% -0.4% 1,38,958
Lubricants & Greases 362
FO & LSHS 585
Bitumen 657
Petroleum coke 1,749
Others 874
TOTAL 20,168
Source- PPAC
Year Till Date: 1st April 2025 – 31st March 2026
November 2025 Page | 32