


Page 46 - Policy Economic Report- June'26
P. 46
POLICY AND ECONOMIC REPORT
           OIL & GAS MARKET

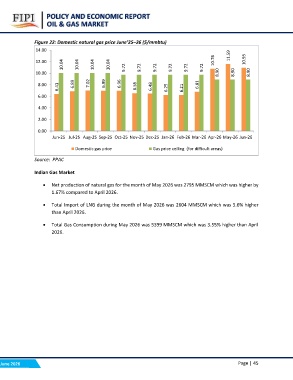
           Figure 22: Domestic natural gas price June’25–26 ($/mmbtu)                                     10.76    11.59   10.93
                                                                                                            8.90     8.90    8.90
           14.00

           12.00
                        10.04  6.89     7.02     6.99     6.96    6.55    6.48    6.25    6.21    6.81
                                 10.04    10.04    10.04    9.72    9.72    9.72    9.72    9.72    9.72
           10.00  6.41
            8.00

           6.00
           4.00
           2.00

           0.00
                    Jun-25 Jul-25 Aug-25 Sep-25 Oct-25 Nov-25 Dec-25 Jan-26 Feb-26 Mar-26 Apr-26 May-26 Jun-26

                               Domestic gas price                         Gas price ceiling (for difficult areas)

           Source: PPAC

           Indian Gas Market

           • Net production of natural gas for the month of May 2026 was 2795 MMSCM which was higher by
               1.67% compared to April 2026.

           • Total Import of LNG during the month of May 2026 was 2604 MMSCM which was 5.6% higher
               than April 2026.

           • Total Gas Consumption during May 2026 was 5399 MMSCM which was 3.55% higher than April
               2026.

June 2026                                                                                                                  Page | 45

