
Page 31 - Policy Economic Report - July 2025
P. 31
POLICY AND ECONOMIC REPORT
OIL & GAS MARKET
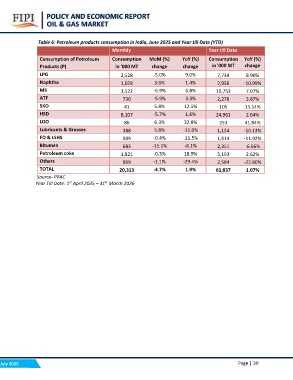
Table 6: Petroleum products consumption in India, June 2025 and Year till Date (YTD)
Monthly Year till Date
Consumption of Petroleum Consumption MoM (%) YoY (%) Consumption YoY (%)
Products (P) in '000 MT change change
change in '000 MT
8.90%
LPG 2,528 -5.0% 9.0% 7,734 -10.99%
3.6% 1.4% 2,956 7.07%
Naphtha 1,028 -6.9% 6.8% 10,753 3.87%
-5.9% 3.3% 2,278 13.14%
MS 3,522 5.8% 12.5% 105 2.64%
-5.7% 1.6% 24,961 41.84%
ATF 730 6.3% 32.8% 253 -10.13%
5.8% -11.0% 1,154 -11.92%
SKO 41 -0.4% -11.5% 1,514 -6.66%
-15.1% -8.1% 2,351 2.62%
HSD 8,107 -0.3% 18.9% 5,193 -22.80%
-1.1% -29.4% 2,584 1.07%
LDO 86 -4.7% 1.9% 61,837
Lubricants & Greases 388
FO & LSHS 509
Bitumen 683
Petroleum coke 1,821
Others 869
TOTAL 20,313
Source- PPAC
Year Till Date: 1st April 2025 – 31st March 2026
July 2025 Page | 30