
Page 30 - Policy Economic Report - September 2025
P. 30
POLICY AND ECONOMIC REPORT
OIL & GAS MARKET
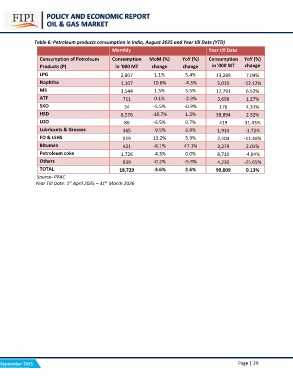
Table 6: Petroleum products consumption in India, August 2025 and Year till Date (YTD)
Monthly Year till Date
Consumption of Petroleum Consumption MoM (%) YoY (%) Consumption YoY (%)
Products (P) in '000 MT change change
change in '000 MT
7.04%
LPG 2,807 1.1% 5.4% 13,289 -12.12%
10.6% -4.3% 5,010 6.52%
Naphtha 1,107 1.5% 5.5% 17,791 1.27%
0.1% -2.9% 3,698 4.31%
MS 3,544 -5.5% -0.9% 176 2.32%
-10.7% 1.2% 38,894 31.43%
ATF 711 -6.5% 0.7% 419 -1.72%
-9.5% 6.9% 1,910 -11.46%
SKO 34 13.2% 5.9% 2,404 2.05%
-8.1% 47.1% 3,279 -4.84%
HSD 6,576 -4.3% 0.0% 8,710 -25.65%
-0.2% -5.9% 4,230 0.13%
LDO 80 -3.6% 2.6% 99,809
Lubricants & Greases 365
FO & LSHS 519
Bitumen 421
Petroleum coke 1,726
Others 839
TOTAL 18,729
Source- PPAC
Year Till Date: 1st April 2025 – 31st March 2026
September 2025 Page | 29