
Page 27 - Policy Economic Report - September 2025
P. 27
POLICY AND ECONOMIC REPORT
OIL & GAS MARKET
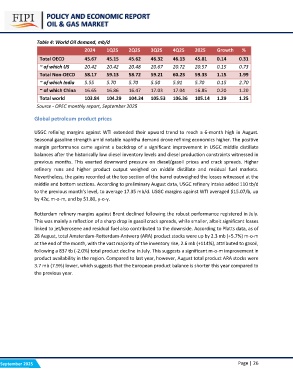
Table 4: World Oil demand, mb/d
2024 1Q25 2Q25 3Q25 4Q25 2025 Growth %
46.32 46.13 45.81 0.14 0.31
Total OECD 45.67 45.15 45.62 20.67 20.72 20.57 0.15 0.73
59.21 60.23 59.33 1.15 1.99
~ of which US 20.42 20.42 20.48 5.50 5.91 5.70 0.15 2.70
17.03 17.04 16.85 0.20 1.20
Total Non-OECD 58.17 59.13 58.72 105.53 106.36 105.14 1.29 1.25
~ of which India 5.55 5.70 5.70
~ of which China 16.65 16.86 16.47
Total world 103.84 104.29 104.34
Source - OPEC monthly report, September 2025
Global petroleum product prices
USGC refining margins against WTI extended their upward trend to reach a 6-month high in August.
Seasonal gasoline strength amid notable naphtha demand drove refining economics higher. The positive
margin performance came against a backdrop of a significant improvement in USGC middle distillate
balances after the historically low diesel inventory levels and diesel production constraints witnessed in
previous months. This exerted downward pressure on diesel/gasoil prices and crack spreads. Higher
refinery runs and higher product output weighed on middle distillate and residual fuel markets.
Nevertheless, the gains recorded at the top section of the barrel outweighed the losses witnessed at the
middle and bottom sections. According to preliminary August data, USGC refinery intake added 110 tb/d
to the previous month’s level, to average 17.35 mb/d. USGC margins against WTI averaged $15.07/b, up
by 42?, m-o-m, and by $1.80, y-o-y.
Rotterdam refinery margins against Brent declined following the robust performance registered in July.
This was mainly a reflection of a sharp drop in gasoil crack spreads, while smaller, albeit significant losses
linked to jet/kerosene and residual fuel also contributed to the downside. According to Platts data, as of
28 August, total Amsterdam-Rotterdam-Antwerp (ARA) product stocks were up by 2.3 mb (+5.7%) m-o-m
at the end of the month, with the vast majority of the inventory rise, 2.6 mb (+114%), attributed to gasoil,
following a 837 tb (-2.0%) total product decline in July. This suggests a significant m-o-m improvement in
product availability in the region. Compared to last year, however, August total product ARA stocks were
3.7 mb (7.9%) lower, which suggests that the European product balance is shorter this year compared to
the previous year.
September 2025 Page | 26