
Page 17 - Policy Economic Report - September 2025
P. 17
POLICY AND ECONOMIC REPORT
OIL & GAS MARKET
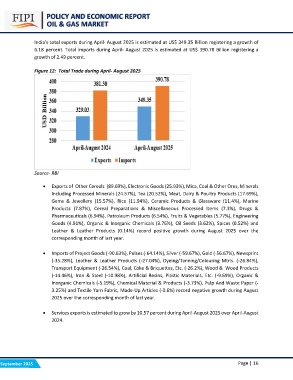
India’s total exports during April- August 2025 is estimated at US$ 349.35 Billion registering a growth of
6.18 percent. Total imports during April- August 2025 is estimated at US$ 390.78 Billion registering a
growth of 2.49 percent.
Figure 12: Total Trade during April- August 2025
Source- RBI
• Exports of Other Cereals (89.69%), Electronic Goods (25.93%), Mica, Coal & Other Ores, Minerals
Including Processed Minerals (24.57%), Tea (20.52%), Meat, Dairy & Poultry Products (17.69%),
Gems & Jewellery (15.57%), Rice (11.94%), Ceramic Products & Glassware (11.4%), Marine
Products (7.87%), Cereal Preparations & Miscellaneous Processed Items (7.3%), Drugs &
Pharmaceuticals (6.94%), Petroleum Products (6.54%), Fruits & Vegetables (5.77%), Engineering
Goods (4.91%), Organic & Inorganic Chemicals (3.76%), Oil Seeds (3.62%), Spices (0.52%) and
Leather & Leather Products (0.14%) record positive growth during August 2025 over the
corresponding month of last year.
• Imports of Project Goods (-90.63%), Pulses (-64.14%), Silver (-59.67%), Gold (-56.67%), Newsprint
(-35.28%), Leather & Leather Products (-27.04%), Dyeing/Tanning/Colouring Mtrls. (-26.84%),
Transport Equipment (-26.54%), Coal, Coke & Briquettes, Etc. (-26.2%), Wood & Wood Products
(-14.46%), Iron & Steel (-10.98%), Artificial Resins, Plastic Materials, Etc. (-9.69%), Organic &
Inorganic Chemicals (-5.19%), Chemical Material & Products (-3.73%), Pulp And Waste Paper (-
3.25%) and Textile Yarn Fabric, Made-Up Articles (-0.6%) record negative growth during August
2025 over the corresponding month of last year.
• Services exports is estimated to grow by 10.57 percent during April-August 2025 over April-August
2024.
September 2025 Page | 16