
Page 21 - Policy Economic Report - October 2025
P. 21
POLICY AND ECONOMIC REPORT
OIL & GAS MARKET
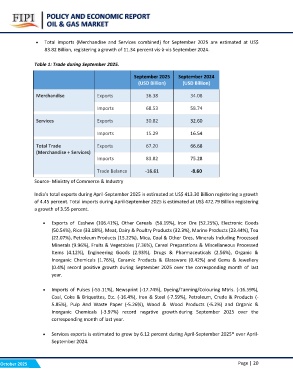
? Total imports (Merchandise and Services combined) for September 2025 are estimated at US$
83.82 Billion, registering a growth of 11.34 percent vis-à-vis September 2024.
Table 1: Trade during September 2025.
September 2025 September 2024
(USD Billion) (USD Billion)
Merchandise Exports 36.38 34.08
Imports 68.53 58.74
Services Exports 30.82 32.60
Imports 15.29 16.54
Total Trade Exports 67.20 66.68
83.82 75.28
(Merchandise + Services)
Imports
Trade Balance -16.61 -8.60
Source- Ministry of Commerce & Industry
India’s total exports during April-September 2025 is estimated at US$ 413.30 Billion registering a growth
of 4.45 percent. Total imports during April-September 2025 is estimated at US$ 472.79 Billion registering
a growth of 3.55 percent.
? Exports of Cashew (106.41%), Other Cereals (58.19%), Iron Ore (52.25%), Electronic Goods
(50.54%), Rice (33.18%), Meat, Dairy & Poultry Products (32.3%), Marine Products (23.44%), Tea
(22.07%), Petroleum Products (15.22%), Mica, Coal & Other Ores, Minerals Including Processed
Minerals (9.96%), Fruits & Vegetables (7.36%), Cereal Preparations & Miscellaneous Processed
Items (4.12%), Engineering Goods (2.93%), Drugs & Pharmaceuticals (2.56%), Organic &
Inorganic Chemicals (1.76%), Ceramic Products & Glassware (0.42%) and Gems & Jewellery
(0.4%) record positive growth during September 2025 over the corresponding month of last
year.
? Imports of Pulses (-55.11%), Newsprint (-17.74%), Dyeing/Tanning/Colouring Mtrls. (-16.59%),
Coal, Coke & Briquettes, Etc. (-16.4%), Iron & Steel (-7.59%), Petroleum, Crude & Products (-
5.85%), Pulp And Waste Paper (-5.26%), Wood & Wood Products (-5.2%) and Organic &
Inorganic Chemicals (-3.97%) record negative growth during September 2025 over the
corresponding month of last year.
? Services exports is estimated to grow by 6.12 percent during April-September 2025* over April-
September 2024.
October 2025 Page | 20