
Page 19 - Policy Economic Report - July 2025
P. 19
POLICY AND ECONOMIC REPORT
OIL & GAS MARKET
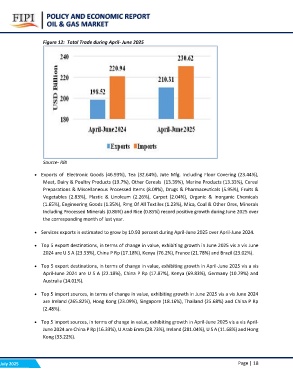
Figure 12: Total Trade during April- June 2025
Source- RBI
• Exports of Electronic Goods (46.93%), Tea (32.64%), Jute Mfg. Including Floor Covering (23.44%),
Meat, Dairy & Poultry Products (19.7%), Other Cereals (13.39%), Marine Products (13.33%), Cereal
Preparations & Miscellaneous Processed Items (8.09%), Drugs & Pharmaceuticals (5.95%), Fruits &
Vegetables (2.83%), Plastic & Linoleum (2.26%), Carpet (2.04%), Organic & Inorganic Chemicals
(1.65%), Engineering Goods (1.35%), Rmg Of All Textiles (1.23%), Mica, Coal & Other Ores, Minerals
Including Processed Minerals (0.86%) and Rice (0.85%) record positive growth during June 2025 over
the corresponding month of last year.
• Services exports is estimated to grow by 10.93 percent during April-June 2025 over April-June 2024.
• Top 5 export destinations, in terms of change in value, exhibiting growth in June 2025 vis a vis June
2024 are U S A (23.53%), China P Rp (17.18%), Kenya (76.2%), France (21.78%) and Brazil (23.02%).
• Top 5 export destinations, in terms of change in value, exhibiting growth in April-June 2025 vis a vis
April-June 2024 are U S A (22.18%), China P Rp (17.87%), Kenya (69.83%), Germany (10.79%) and
Australia (14.01%).
• Top 5 import sources, in terms of change in value, exhibiting growth in June 2025 vis a vis June 2024
are Ireland (265.82%), Hong Kong (23.09%), Singapore (18.16%), Thailand (25.68%) and China P Rp
(2.48%).
• Top 5 import sources, in terms of change in value, exhibiting growth in April-June 2025 vis a vis April-
June 2024 are China P Rp (16.33%), U Arab Emts (28.73%), Ireland (281.04%), U S A (11.68%) and Hong
Kong (33.22%).
July 2025 Page | 18