
Page 37 - Policy Economic Report - Jan 2026
P. 37
POLICY AND ECONOMIC REPORT
OIL & GAS MARKET
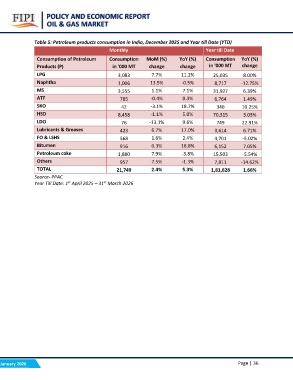
Table 5: Petroleum products consumption in India, December 2025 and Year till Date (YTD)
Monthly Year till Date
Consumption of Petroleum Consumption MoM (%) YoY (%) Consumption YoY (%)
Products (P) change
in '000 MT change change in '000 MT
8.00%
LPG 3,083 7.7% 11.2% 25,035 -12.75%
13.5% -0.5% 8,717 6.39%
Naphtha 1,006 1.1% 7.1% 31,927 1.49%
-0.4% 0.3% 6,764 10.25%
MS 3,555 -3.1% 18.7% 340 3.03%
-1.1% 5.0% 70,315 22.91%
ATF 785 -13.1% 9.6% 749 6.71%
6.7% 17.0% 3,614 -5.02%
SKO 42 1.6% 2.4% 4,701 7.05%
0.3% 18.8% 6,152 -5.54%
HSD 8,458 7.9% -3.8% 15,503 -14.62%
7.5% -1.3% 7,811 1.66%
LDO 76 2.4% 5.3% 1,81,628
Lubricants & Greases 423
FO & LSHS 568
Bitumen 916
Petroleum coke 1,880
Others 957
TOTAL 21,749
Source- PPAC
Year Till Date: 1st April 2025 – 31st March 2026
January 2026 Page | 36