
Page 34 - Policy Economic Report - Jan 2026
P. 34
POLICY AND ECONOMIC REPORT
OIL & GAS MARKET
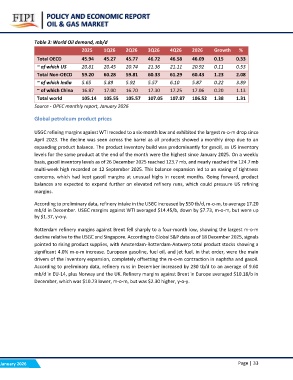
Table 3: World Oil demand, mb/d
2025 1Q26 2Q26 3Q26 4Q26 2026 Growth %
46.72 46.58 46.09 0.15 0.33
Total OECD 45.94 45.27 45.77 21.36 21.11 20.92 0.11 0.53
60.33 61.29 60.43 1.23 2.08
~ of which US 20.81 20.45 20.74 5.57 6.10 5.87 0.22 3.89
17.30 17.25 17.06 0.20 1.13
Total Non-OECD 59.20 60.28 59.81 107.05 107.87 106.52 1.38 1.31
~ of which India 5.65 5.89 5.92
~ of which China 16.87 17.00 16.70
Total world 105.14 105.55 105.57
Source - OPEC monthly report, January 2026
Global petroleum product prices
USGC refining margins against WTI receded to a six-month low and exhibited the largest m-o-m drop since
April 2023. The decline was seen across the barrel as all products showed a monthly drop due to an
expanding product balance. The product inventory build was predominantly for gasoil, as US inventory
levels for the same product at the end of the month were the highest since January 2025. On a weekly
basis, gasoil inventory levels as of 26 December 2025 reached 123.7 mb, and nearly reached the 124.7 mb
multi-week high recorded on 12 September 2025. This balance expansion led to an easing of tightness
concerns, which had kept gasoil margins at unusual highs in recent months. Going forward, product
balances are expected to expand further on elevated refinery runs, which could pressure US refining
margins.
According to preliminary data, refinery intake in the USGC increased by 550 tb/d, m-o-m, to average 17.20
mb/d in December. USGC margins against WTI averaged $14.45/b, down by $7.73, m-o-m, but were up
by $1.37, y-o-y.
Rotterdam refinery margins against Brent fell sharply to a four-month low, showing the largest m-o-m
decline relative to the USGC and Singapore. According to Global S&P data as of 18 December 2025, signals
pointed to rising product supplies, with Amsterdam-Rotterdam-Antwerp total product stocks showing a
significant 4.0% m-o-m increase. European gasoline, fuel oil, and jet fuel, in that order, were the main
drivers of the inventory expansion, completely offsetting the m-o-m contraction in naphtha and gasoil.
According to preliminary data, refinery runs in December increased by 230 tb/d to an average of 9.60
mb/d in EU-14, plus Norway and the UK. Refinery margins against Brent in Europe averaged $10.18/b in
December, which was $10.73 lower, m-o-m, but was $2.30 higher, y-o-y.
January 2026 Page | 33