
Page 25 - Policy Economic Report - Jan 2026
P. 25
POLICY AND ECONOMIC REPORT
OIL & GAS MARKET
Initiatives such as the Trade and Technology Council, the Global Gateway, IMEC, and progress in FTA
negotiations reflect deepening institutional alignment between India and the EU. Building on this
momentum, India’s invitation to the President of the European Council, H.E. Mr. António Luís Santos da
Costa, and the President of the European Commission, H.E. Ms. Ursula von der Leyen, for a State Visit
from 25–27 January 2026 underscores government intent to elevate India-EU relations as a core pillar of
its global and European strategy.
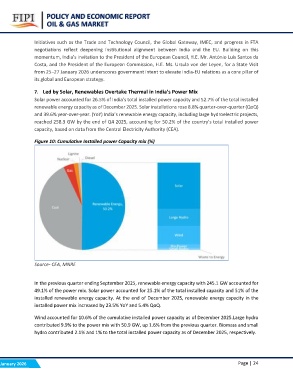
7. Led by Solar, Renewables Overtake Thermal in India’s Power Mix
Solar power accounted for 26.5% of India’s total installed power capacity and 52.7% of the total installed
renewable energy capacity as of December 2025. Solar installations rose 8.8% quarter-over-quarter (QoQ)
and 39.6% year-over-year. (YoY) India’s renewable energy capacity, including large hydroelectric projects,
reached 258.3 GW by the end of Q4 2025, accounting for 50.2% of the country’s total installed power
capacity, based on data from the Central Electricity Authority (CEA).
Figure 10: Cumulative Installed power Capacity mix (%)
Source- CEA, MNRE
In the previous quarter ending September 2025, renewable energy capacity with 245.1 GW accounted for
49.1% of the power mix. Solar power accounted for 25.1% of the total installed capacity and 51% of the
installed renewable energy capacity. At the end of December 2025, renewable energy capacity in the
installed power mix increased by 23.5% YoY and 5.4% QoQ.
Wind accounted for 10.6% of the cumulative installed power capacity as of December 2025.Large hydro
contributed 9.9% to the power mix with 50.9 GW, up 1.6% from the previous quarter. Biomass and small
hydro contributed 2.1% and 1% to the total installed power capacity as of December 2025, respectively.
January 2026 Page | 24